Click for Red Bull Stratos mission website.
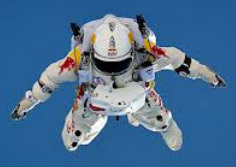
For the casual observer--well, hang on--no one casually observed Felix Baumgartner's jump from the edge of space on October 14th, 2012. Not everyone who watched had their mind racing like mine was, but I am certain that this feat is one more than befitting of #101qs and #3Acts formatting.
What follows on this post is what I have managed to use in my own class to help quench students' curiosity about the Red Bull Stratos project, which sent a helium-filled balloon up to 128,100 feet and had Austrian skydiver Felix Baumgartner jump back to the Earth wearing a pressurized suit.
What follows on this post is what I have managed to use in my own class to help quench students' curiosity about the Red Bull Stratos project, which sent a helium-filled balloon up to 128,100 feet and had Austrian skydiver Felix Baumgartner jump back to the Earth wearing a pressurized suit.
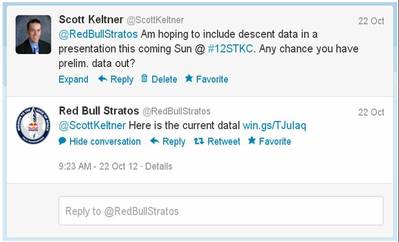
I got a response back from Red Bull Stratos!
This coming Sunday morning, I will be presenting at the STEMtech Conference in Kansas City and was hoping to use an example from the Red Bull Stratos jump within my talk to show how velocity, acceleration, deceleration, and time can relate to one another--both for the balloon's ascent and Felix's descent back to the Earth.
So, I tweeted the Red Bull Stratos folks. With 240,000+ followers, I figured it had fallen on deaf ears (although, since they're used to travelling faster than the speed of sound, they could use "I couldn't hear you" as a valid excuse).
Nevertheless, I set out to collect some data points for use on the TI-Nspire CX using the Teacher Software. Below is a slide show of some of the work I completed. What I hoped students would take away from these graphs included:
Also, I'm including a link to the data I used to compile this activity on this post both as a Google Docs Spreadsheet and a Microsoft Excel file, and also the TI-Nspire CX document used here (this can be downloaded, then viewed within the TI-Nspire Document Player without needing software purchase or download of trial versions). Please use either however you see fit and let me know how it works for your class.
The ascent data was gathered from this post on Wikipedia.
The descent data was gathered by watching and pausing this YouTube video a couple different times (NOTE: these were approximate velocities and subject to verification and should not be considered 100% accurate, but did work well enough to conduct the lesson I was looking to convey).
So, I tweeted the Red Bull Stratos folks. With 240,000+ followers, I figured it had fallen on deaf ears (although, since they're used to travelling faster than the speed of sound, they could use "I couldn't hear you" as a valid excuse).
Nevertheless, I set out to collect some data points for use on the TI-Nspire CX using the Teacher Software. Below is a slide show of some of the work I completed. What I hoped students would take away from these graphs included:
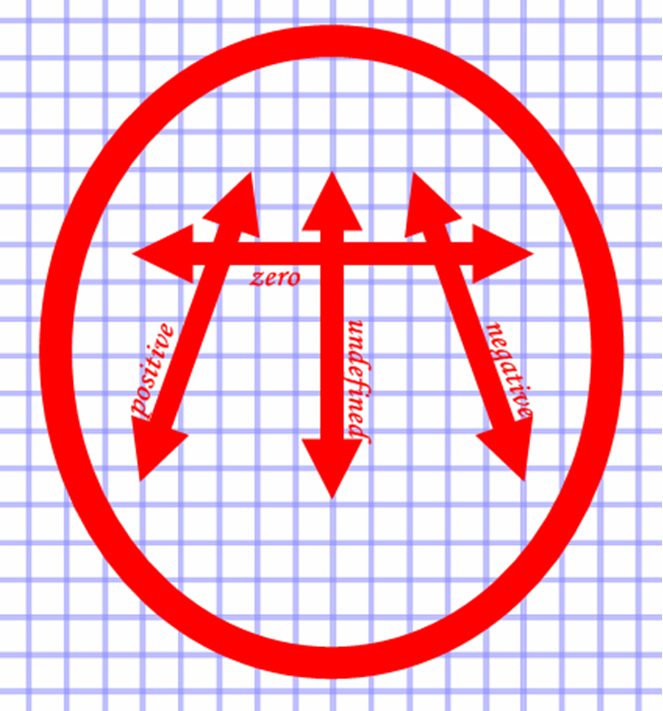
- The balloon appears to make a fairly constant ascent, but careful inspection would reveal the upward velocity of the balloon actually varied much more than at first glance.
- Does the elevation vs. time graph of Felix's descent convey enough information for us to know when he deployed his parachute? (This would be a great time to introduce the idea of a secant line to students, as a BRIEF introduction to a Precalculus and Calculus topics such as average rate of change and limits)
- Does the velocity vs. time graph of Felix's descent show enough to let us identify when he is accelerating and decelerating, when his parachute was deployed, and when he touched earth again?
Also, I'm including a link to the data I used to compile this activity on this post both as a Google Docs Spreadsheet and a Microsoft Excel file, and also the TI-Nspire CX document used here (this can be downloaded, then viewed within the TI-Nspire Document Player without needing software purchase or download of trial versions). Please use either however you see fit and let me know how it works for your class.
The ascent data was gathered from this post on Wikipedia.
The descent data was gathered by watching and pausing this YouTube video a couple different times (NOTE: these were approximate velocities and subject to verification and should not be considered 100% accurate, but did work well enough to conduct the lesson I was looking to convey).
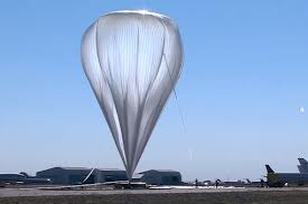
Click for more information on the Red Bull Stratos balloon.
The other information I wanted to include in this lesson, but did not focus on in this lesson, included facts and figures about the balloon used in the Red Bull Stratos mission.
At lift-off, the balloon was nearly 200,000 cubic feet (or 100,000 Giant Jenga games, as I was able to illustrate with my students in class, since we recently worked with it). At its highest point, the balloon was nearly 30,000,000 cubic feet large (which I related to my students by having them envision a cube that is as long, wide, and tall as a football field--a cube with side lengths about 310 feet on a side). Check this blog post on how the balloon compares with the Statue of Liberty
When we approach a lesson that involves transformations of solids (impact on volume and surface area when a single dimension is altered), I will likely revisit this topic again with a different focus in mind.
As much energy as my students brought to this lesson, then finding out that there were over 8 MILLION simultaneous YouTube viewers of the Red Bull Stratos mission (which was not mentioned on the mission's blog post among the other records and noteworthy feats achieved), I knew that this was a topic that would grab their attention.
I also know how much my own mind was racing as I was watching the broadcast of the mission, so to leave it alone would be unheard of. But when the speed of sound was broken during the fall, that is the play on words I was hoping for: "unheard of."
Mission accomplished. Thank you for being a great example to our students, Felix Baumgartner! Wait! An example in a lesson, I'm not saying that all our students should go jump in balloons and take up this sort of skydiving! There. I have to cover that segment of the population that will try and one-up this record by any means necessary.
--Keltner--

 RSS Feed